Spreadsheet Risk is
the Number One Threat to Supply Chain Excellence
Spreadsheet
use pervades every corner of corporate life today. More than 200 million people
worldwide use spreadsheet applications and about one-third of people spend more
than half their working days using them.*(1)
Spreadsheets
provide great benefit, but also create serious issues. It’s easy to get an answer
from a Spreadsheet - but it may not be easy to get the correct answer, given:
·
General
spreadsheet risk due to the limited accuracy of the tool itself and the risk of data and logic flaws introduced by
users (researchers estimate 94% of deployed spreadsheets contain errors, and 90%
of spreadsheets over 150 rows contain
errors).
·
Spreadsheet-related
supply chain risks that emerge as the supply chain matures (scalability,
integration, fragility, siloing, and others).
Supply
chain management teams can find themselves severely hampered by chronic spreadsheet
shortcomings when performing mission critical activities such as demand
planning, sales and operations planning, manufacturing, replenishment and supply
planning, inventory optimization, and value chain collaboration.
What
are the inherent limitations of spreadsheet applications? What special pitfalls
face supply chain teams who force spreadsheets to handle more complexity than they
are designed for? This paper explores these questions.
“The supply
chain as a complex system cannot be effectively modelled in a spreadsheet.”
- Lora Cecere,
Founder, Supply Chain Insights
Where Did All These
Spreadsheets Come From?
Most
managers know how to build spreadsheets, and the application is on everyone’s
PC, ready to go at a moment’s notice. Self-trained spreadsheet jockeys, when
faced with the problem of organizing data and calculating future requirements, grab
the tool they know.
In
companies with simple supply chains, a few product offerings, and a small
number of customers, sooner or later someone authors a forecasting spreadsheet
with a row for each item and columns for time periods, and the Spreadsheet Era
has begun. Soon spreadsheets proliferate, driven by:
·
Inability
of the organization’s ERP system to meet the need. ERP supply chain management
modules are invariably rudimentary, inflexible, and proprietary. Thus, managers
turn to spreadsheets.
·
A
“stop gap” urgency to gain control over supply chain data. Before an organization’s
processes have matured enough to select a robust, reliable, unified solution,
spreadsheets look like an adequate response to an immediate need.
·
Supply
chain stakeholders are driven by a DIY spirit. They naturally seize on any opportunity
to create flexible solutions relatively quickly, customized to their own needs,
without involving the organization’s bureaucracy.
·
Spreadsheet
culture easily spreads into every facet of the global supply chain, without
proper security or audit trails, but with an ever-present probability for
serious error. Eventually, trying to manage the sheer volume of spreadsheets,
trying to generate insights and actionable conclusions within a useful timeframe,
and maintaining communication among isolated owner/operators becomes organizationally
exhausting.
Inherent Problems and
Limitations of Spreadsheets
Some
problems with spreadsheets are universal, and affect any business that relies on
them. A study (*2) covering 1,500 people in the UK found that 57% of
spreadsheet users had never received formal training on the spreadsheet package
they use.
Chronically Prone to
“Pilot Error”
In
supply chain management, the impact of a single error can derail a forecast,
cause a supplier to ship too much or too little of a particular product, or
cause service level nightmares that can lose a customer.
Researchers
Powell, Baker, and Lawson estimated that roughly 94% of spreadsheets deployed
in the field contain errors, while 5.2% of cells in unaudited spreadsheets contain
errors (*3). Coopers and Lybrand found 90% of all spreadsheets comprised of more
than 150 rows contained errors (*4) and KPMG found 91% of 22 spreadsheets taken
from an industry sample contained errors (*5).
Compared
to these findings, a University of Hawaii study that estimated 20% to 40% of
all spreadsheets contain errors is positively upbeat (*6).
Clearly,
a spreadsheet is only as good as the last person who edited it. Lack of
adequate auditing and revision control makes it impossible to determine what,
why and when someone changed a cell.
A Very Costly
Error
One leading
maker of OEM-compatible imaging supplies used spreadsheets created by their
planners to drive product replenishment. A mistake in a formula related to one
of their critical raw materials caused them to order 4 times more toner than
intended. In order to deliver the unexpected quantity on time, the vendor
changed its process, which led to quality problems that were not discovered
until the product was shipped to customers. Ultimately the company recalled $4
million worth of cartridges and the vendor had to replace $8 million of toner.
Total
cost of one spreadsheet error: $12,000,000.
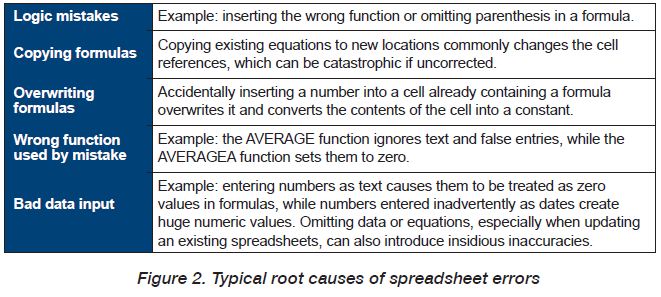
Unavoidably hard to
maintain
When
someone authors a spreadsheet layout, they are essentially creating a
nonprocedural computer program. Nonprocedural programming offers as many
chances for mistakes as procedural programming, yet spreadsheets are rarely
checked or tested thoroughly, and are usually rolled out without a formal
quality assurance process.
Over
time, supply chain spreadsheets often gain features like conditional formatting
to flag exception conditions, charts and graphs to display data visually,
analysis components to identify trends, and more. Multiple spreadsheets may be
linked together in order to feed results upstream and downstream, or to drive
high-level business decisions. Each enhancement adds risk, especially if the
spreadsheet’s original design requires major revamping to add the new features.
As
more users interact with the spreadsheet, there is a need to control read/write
access based on user roles, something SCM solutions offer but spreadsheets
don’t.
Vulnerable to single
points of failure
A
spreadsheet often reflects the work of essentially one person. If that person
leaves the company or changes jobs, that spreadsheet becomes an unsupported
single point of failure. If there are multiple spreadsheet authors around the
supply chain organization, then there are multiple potential single points of
failure.
Dangerous
single points of failure should not be allowed to exist in any tool that
influences mission critical decisions driving company operations. Better to
adopt a best-of-breed supply chain software solution that is maintained and
regularly enhanced by a dedicated team of developers.
Major
Spreadsheet Problems in Supply Chain Management
Every
time you turn to a spreadsheet to handle some aspect of supply chain
management, you open up a can of risk.
Real-world
supply chains have management challenges that cannot be adequately addressed by
a spreadsheet approach—challenges such as variable lead-times, unpredictable
demand, suppliers who miss due dates, production lines or outsourced sites that
don’t always cooperate, multiple streaming sources of data each with its own
impact on dynamic global business objectives.
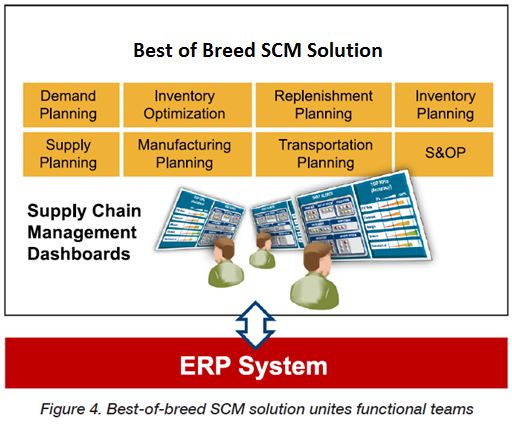
Unlike
spreadsheets, supply chain management solutions comprehend factors such as the
availability of resources, the capacity and optimal utilization levels of
equipment, and the most cost-efficient positioning of inventory, with
annotation capabilities to record why each change was made to the plan. A
best-of-breed SCM system avoids major spreadsheet drawbacks such as:
The Scalability
Problem:
Not
only do today’s complex supply chains require businesses to anticipate market
changes and respond quickly to real-world events, there are an ever increasing
number of users who need to share data, and a growing volume of SKUs to plan
for. According to Chainlink Research, “Spreadsheets provide some capability for
users to be creative and think though some ideas. For simple tasks, and for
businesses with small SKU counts and low complexity, they might work to a
degree. But they just don’t scale.”
For
even mid-size supply chains, a proper database with built-in rules for
structuring data, maintaining data integrity, and developing audit trails is
far more suitable.
Other
issues related to scale include the growing size of demand and supply planning
hierarchies, which cover huge numbers of items, from SKU-location to product
categories. Multiple forecast models are needed to best predict demand for each
lifecycle stage of every product and market. Planning accuracy should be
measured over multiple time intervals (three months for sales, 18 months for finance,
six to 24 months for supply planners, etc.). This is well beyond the capability
of spreadsheets.
The Functional
Isolation Problem:
Even
organizations that place their spreadsheets on a central server can’t ensure
that collaboration behaviour takes root across functional silos.
Most
organizations using the spreadsheet approach find that each department,
geographical location, or even individual worker may be relying on a separately
managed and maintained spreadsheet. When crucial supply chain activities like
demand management, inventory management, production scheduling, supply and
replenishment operations, and transportation planning are all performed in
isolation with the results expressed in parochial terms, no one’s numbers ever
seem agree with anyone else’s. This creates a “Supply Chain Tower of Babel”
where one department doesn’t know what the others are doing. Sharing
information is cumbersome, translation is difficult, and collaboration is
discouraged.
To
the extent that spreadsheet reliance increases isolation, it works against
collaboration initiatives and demand-driven processes like sales and operations
planning (S&OP). One of the first steps in any S&OP project should be
to evolve away from departmental spreadsheets toward a unifying supply chain
management solution that provides one accurate model of the supply chain and
one set of facts based on up-to-the-minute data.
The ERP Integration
Problem:
Planning
tools must exchange information such as inventory levels, orders, supply-side
information, and more with the company’s existing ERP system. The reality is
that data loading into spreadsheets is always a non-real-time, manual process,
very slow and prone to data entry errors.
Best-of-breed
SCM solutions provide template-assisted integration tools that streamline
set-up time and minimize implementation costs.
The
benefits are worth the effort. A supply chain management solution can
incorporate many streams of data (orders, shipments, inventories, bills of materials,
manufacturing costs, etc.) from existing systems around the company, and
provide a degree of supply chain optimization far exceeding anything that can
be accomplished with spreadsheets. SCM applications increase service levels,
minimize inventory, improve planning efficiency, handle demand uncertainty and
supply volatility, manage product life cycles for maximum profitability and
availability, and drive fact-based S&OP decisions.
The Fragility
Problem:
To
perform integrated supply chain planning, companies must connect multiple
groups within an organization (from planning and operations down to supply
chain and procurement). Global supply chain management requires extending
supply chain visibility to the outside world (i.e. suppliers, customers, etc.)
to increase the speed of activities from asset recovery to recycling.
When
functional groups attempt to feed information (such as demand forecasts) to the
spreadsheets of other functions (such as supply planning) the chain is only as
strong as its weakest link. Linked spreadsheets become cumbersome to maintain.
The information “conduits” flowing from one sheet to another enable cascading
error conditions that can prevent users from obtaining critical results on
time. The probability that a link in the spreadsheet chain is bad increases the
single-point-of-failure problem exponentially.
The Slow
Time-to-Decision Problem:
Spreadsheets
don’t serve up key trends and exception conditions on a silver platter. It
takes much longer to gather, assess, and evaluate information held in
spreadsheets. Manual spreadsheet data updates are followed by manual
examinations to spot issues, and a reporting phase, all of which takes time.
Lacking
real-time alerts triggered by exceptions to target value ranges for key performance
indicators, supply chain managers are forced to manually monitor hundreds or
many thousands of items. They can literally spend all day perusing spreadsheets
for signs of trouble, big and small.
Executives
shouldn’t have to get their picture of what’s going on through batch status
reports in Microsoft Excel or PowerPoint, nor should they have to request
frequent custom report runs to answer questions (reports that must be manually
generated by supply chain practitioners with other pressing demands on their
time).
With
spreadsheets, the risk is 100% that critical out-of-balance conditions will be
missed or major deviations detected late. Crucial business decisions should be
based on real-time access to up-to-date supply chain data, and management reaction
times should be driven by automated alerts that let planners prioritize
efficiently and manage by exception.
How
Spreadsheets Fall Short In Multiple Supply Chain Disciplines
Demand
Planning/Forecasting:
Demand
planning is a dynamic, collaborative process. Spreadsheets make it onerous or
impossible to establish a repeatable cadence, an efficient month-by-month
process. Actual demand data must be manually entered into a spreadsheet, rather
than automatically fed from operational systems. Spreadsheets lack support for
collaboration with suppliers, do not provide wide visibility to inventory at
all locations, and can’t run robust “what if” analyses that are crucial to
handling uncertain demand over a time horizon of many months. Spreadsheets are
really only suited to static demand rather than the dynamic demand signals
found in real world markets.
Because
forecasts are, by definition, not perfectly accurate, it is crucial to measure
the system-generated forecast, planners’ forecast, and customers’ forecast against
actual data. Demand planning systems measure forecast accuracy using mean
absolute percentage error (MAPE) and weighted MAPE (WMAPE) over several
intervals (one month, three months, and 12 months are the most common horizons.
A
best-of-breed planning solution provides multiple forecasting models (even
handling difficult statistical challenges involving “low and lumpy” demand
signals) with the ability to switch among models easily.
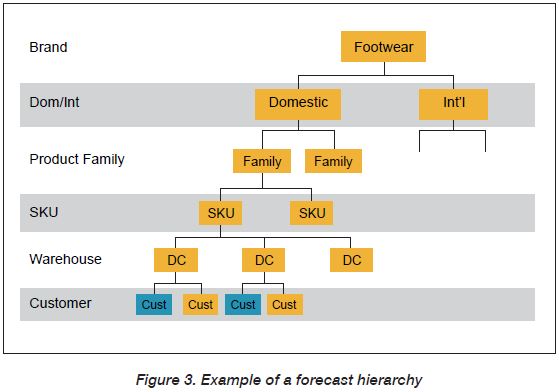
SCM
systems can maintain separate forecast hierarchies for each department, with
each hierarchical stack containing forecasts at the SKU-location level up to
the product family, category, or customer level. A high-level forecast is
statistically more accurate than individual components, so disaggregating the
forecast down the hierarchy can improve accuracy at every level.
Inventory Management
Using
spreadsheets to plan stock levels and calculate inventory replenishment leaves
critical inventory optimizations out of the equation. Safety stock levels may
be calculated using prebuilt basic formulas such as moving average and standard
deviation, but planners will not have the ability to see the entire supply and
demand relationship, or take into account interactions between sites in the
supply chain that cause inventory buffers to grow unnecessarily large.
When
safety stock is calculated by a best-of-breed supply chain application,
managers gain visibility to inventory levels company-wide, set appropriate
inventory targets, and right-size buffers to minimize excess safety stock while
meeting or improving on desired customer service levels.
Supply and
Manufacturing Planning
Spreadsheets
are not able to model a realistic supply chain planning network through
accurate demand tracing and simultaneous sourcing. Dynamic real-time sourcing
evaluates production, storage and transportation constraints to optimize
complex sourcing and production decisions. Real-time alerts let supply planners
prioritize and address high-impact issues more quickly.
In
the manufacturing plant, product mix has a significant impact on total
throughput, so “capacity” is never a straightforward number. Spreadsheets must
include formulas and matrix calculations to accurately project future capacity
usage, again turning planners into programmers.
In
addition, fulfillment planning models such as Available-to-Promise,
Capable-to-Promise and Profitable-to-Promise are beyond the scope of
spreadsheet applications.
Sales and Operational
Planning (S&OP)
The
cornerstone of any successful S&OP process is analysing information
gathered from various areas of the organization. Spreadsheets have significant
limitations when it comes to sharing information, creating “what if” scenarios
and helping management teams understand the full sweep of the business.
One
of the overriding imperatives for the monthly S&OP meeting is to bring
stakeholders together—to have “one version of the truth”—not set them at odds
with each other over a cacophony of competing spreadsheets from each
department.
Activities
like statistical forecasting and requirements planning are based on intensive
mathematical calculations. What-if analysis creates competing scenarios based
on certain assumptions. Generating, comparing, and contrasting these scenarios
quickly is essential to support better business decisions.
Building
a long-term S&OP process on a foundation of function-specific spreadsheets
is a recipe for failure. Only a comprehensive supply chain management system
can convert function-specific data to information, refine that raw information
into actionable intelligence, and support confident strategic business
decisions.
Moving
Beyond Spreadsheets: A Real-World Example
One
shoe company supply chain manager described their style-by-warehouse forecasting
regime as a “complex nightmare,” with 450 pages of spreadsheets to go over
every month.
The
litany of problems included error-prone manual data entry, limited forward
visibility, unreliable information, no tracking of changes or why they were
made, no collaboration with sourcing and manufacturing teams, and forecasts
that were four weeks out of date when shared.
One
typical error involved adding new products to the spreadsheet but forgetting to
bring the subtotal up to the top. The new products were therefore not included
in the forecast at all.
Moving
to a best-of-breed solution delivered many benefits, including:
·
Automated
data flows for inventory changes, orders, etc. from ERP and other sources into the
solution in flat files.
·
Individual
real-time views customized to stakeholders’ (finance, sales, suppliers)
preferences regarding items, styles, and other characteristics
·
Attribute-based,
hierarchical views for sales, marketing, and finance
·
Forecast
creation in three days versus 2+ weeks, including multiple forecasts for
locations around the world fed automatically into the ERP system.
·
Support
for 18 month rolling demand plan
·
Alerts
show visibly how the forecast is holding up—managed by exception
·
Better
data and more granular data for everyone
·
Weighted
mean absolute percentage error (WMAPE) dropped by 15%
·
Data
export for key suppliers completed in three minutes rather than many hours.
Reporting time cut from hours to minutes.
Supply
chain team members now spend their time as analysts, not data manipulators,
getting accurate information faster and using their time more wisely.
Conclusion:
Best of Breed Solutions Save Companies from Spreadsheet Risk
Spreadsheets
proliferate throughout the supply chain organization for several reasons,
including weak SCM capabilities in ERP systems, disjointed stop-gap measures to
get control over supply chain processes, and do-it-yourself attitudes in
organizations that have not matured enough to adopt best-of-breed SCM
solutions.
Relying
on spreadsheets to perform supply chain management involves a host of pitfalls.
Spreadsheets are extremely prone to “pilot error,” with over 90% of deployed
150-row sheets estimated to contain errors. They are hard to maintain over
time, and create dozens of single points of failure, any one of which could
derail supply chain success.
Don’t
wait for a disastrous spreadsheet error or a decision based on out-of-date information
to devastate your competitiveness, public reputation, or bottom line. Supply
chain teams should seek a comprehensive SCM solution that prevents spreadsheet
risk from threatening their commercial well-being.
*1 - Robert Kugel, Ventana Research, ”Make
Spreadsheet Competence a Priority,” June 2012
*2 - ClusterSeven,
“Spreadsheet Risk Management within UK Organisations,” July 2011
*3 - Powell,
Baker, and Lawson, “A Critical Review of the Literature on Spreadsheet Errors,”
December 2007
*4 - Journal
of Accountancy, “How to Make Spreadsheets Error-Proof”
*5 - KPMG
Management Consulting, “Supporting the Decision Maker: A Guide to the Value of
Business Modeling”
*6 - Ray
Panko, Professor of IT Management, University of Hawaii, 2008, 2010

Contributed by:
Jonathan Jackman, EMEA Sales Director, Logility Supply Chain Solutions