Forecasting Best Practices for Varying Supply Chain Scenarios
Typically, a variety of forecasting methods are applicable to any particular type of supply chain scenario. Smart supply chain planners use multiple methods tuned to perform well at different phases of the product life cycle, chosen to best exploit the available historical data and degree of market knowledge. The key is to pick the most effective and flexible models, blend their best features, and shift between them as needed to keep forecast accuracy at its peak.
In this article we will take a brief look at seven methods that have produced superior results for our clients in a variety of industries and market conditions around the world.
Three Categories of Forecasting Models
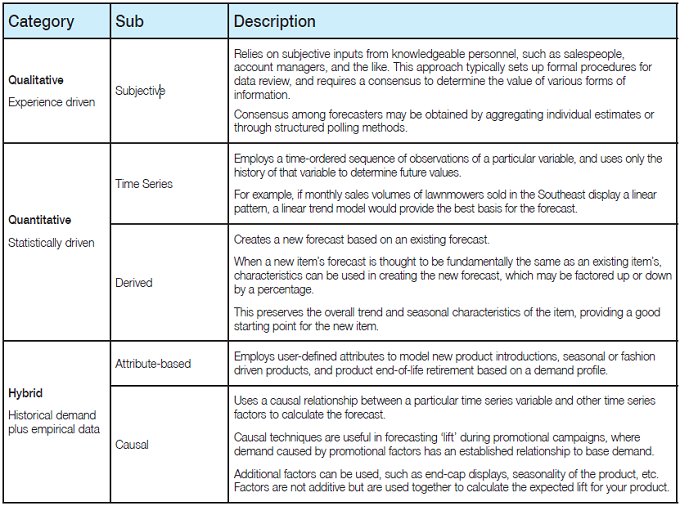
Forecasting models classically fall into three categories: qualitative, quantitative and hybrid. The primary differences between them include the type of input data and the mathematical and statistical methods employed to generate forecasts.
Qualitative models are experience-driven, relying on subjective inputs from knowledgeable personnel, such as salespeople, account managers, and the like.
Quantitative models are statistically driven, drawing heavily on historical performance data as the basic data input. The calculating logic is defined and operations are purely mathematical.
Hybrid models typically draw on historical demand information as a starting point, then use empirical data to further refine the forecast.
Three Categories: Forecasting Models
Seven Forecasting Methods that Improve Supply Chain Performance
For many supply chain scenarios, it’s typically best to employ a variety of methods to obtain optimal forecasts. Ideally, managers should take advantage of several different methods and build them into the foundation of the forecast.
The best practice is to use automated method switching to accommodate selection and deployment of the most appropriate forecast method for optimal results.
In order to ensure optimal demand forecasting, managers must employ the forecasting methods that best serve the unique dynamics of their business at a specific moment in time.
Advanced demand planning and forecasting systems automate many of the functions required to select, model and generate multi-echelon forecasts, lifting the burden of manually intensive approaches and accelerating sensitivity to model changes as market conditions evolve. A best practices approach also must include the ability to incorporate personal expertise and weight the various factors in generating forecasts.
In our experience working with over 1,000 organisations ranging across dozens of industries, seven specific forecasting methods stand out. Their unique strengths combine to deliver powerful, flexible, and accurate results.
Seven Methods for More Accurate Forecasting
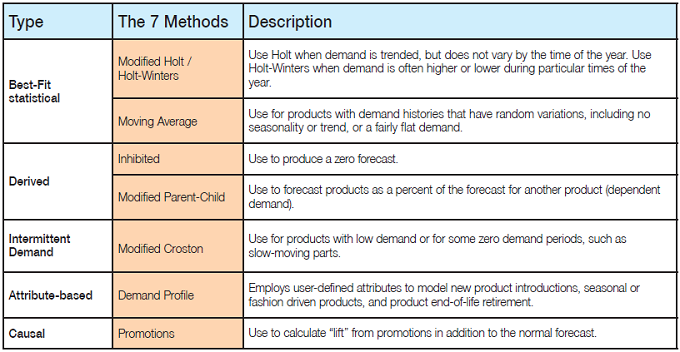
Best-fit Statistical Modeling
For most levels of management within an organization, aggregated demand history for product family, brand category, country and/or selling region are good predictors of future performance. Such demand history also serves as a baseline for effectively forecasting Stock Keeping Units (SKUs.) When there are more than four-to-six periods of sales history, SKUs can be effectively forecast with moving average and basic trend methods. SKUs with at least one year of sales history offer sufficient information to incorporate a seasonal profile into the projected trend.
A modified Holt-Winters decomposition model with best-fit analysis can generate forecasts based on demand history that incorporate trends and seasonal information. The method “senses” the amount of history available for each time series or segment to create a basic model that best fits the history. Then it uses the best combination of smoothing factors to enable the model to react to changing conditions going forward without over-reacting to anomalies in demand (such as unplanned seasonal events, transportation disruptions and so on).
For factors relating to seasonality, planners need the ability to ‘weight’ the historical demand. Under the assumption that the previous year is the best indicator of what will happen next year, most forecast systems apply a higher weighting factor to the previous year’s demand, less to the year before and even less to the years before that. But if the previous year was unusual in any significant way, the planner must have the capability to change the historical weighting factors (so that the history two years ago has more impact on the current forecast than last year, for instance) so as not to under- or over-forecast the business.
Seasonal methods can be effective with less than 24 months of history; the minimum required is 12 months. An effective approach for expected seasonal items with less than 12 months of history is to assign a seasonal curve that has been captured from a similar item or item group.
A powerful best-fit statistical method should include flexible features such as trend, seasonal-with-trend, moving average and low-level pattern fitting, as well as trend models for products with sporadic, low-volume demand.
The method should provide limiting and damping, as well as seasonal smoothing, demand filtering, reasonability tests, tracking signals and tests for erratic nature that evaluate the validity of each element, determining which are anomalous and should be filtered. These parameters give the planner the flexibility to tune the process to best fit conditions at any element of the organization.
“Best fit” refers to the ability to change forecast methods as a product evolves. The process may start out as a demand profile method, evolve to a modified Holt-Winters method as the product becomes stable, and ultimately transition to a demand profile method again as the product life cycle comes to an end.
Capabilities that will automatically change the forecast method are important features of a comprehensive forecasting solution.
Derived Modeling
One method of generating new product forecasts is to use demand variations or extensions from existing products, families or brands. Consequently, they draw on the historical data of existing products or families. When combined with causal effects or management-selected overrides to accommodate introductory promotions, derived modeling can provide a realistic and dynamic forecast for new products.
Using this approach, new products are assigned a percentage of the parent, family and/or brand, enabling them to proportionately inherit a forecast that contains the base, trend and seasonal elements of the associated category. As the forecast for the associated category is adjusted to reflect changing conditions over time, so too is the derived product’s forecast. If the derived product’s point-of-sales (POS) or demand levels deviate from the forecast and exceed a user-defined tolerance, the system can generate a performance management alert to notify forecast analysts to take corrective action.
Once the product has accumulated sufficient demand history of its own, the link to the derived model’s source model is severed and the product is then forecasted on its own using multiple best-fit statistical methods.
Modelling for Intermittent Demand
Slow-moving parts typically exhibit irregular demand that may include periods of zero or excessively lumpy demand. A Modified Croston Method handles low and lumpy demand that exhibits either a patterned variation or no pattern.
The patterned variation looks at available history and classifies each demand element relative to those around it. It classifies the periods into peaks, valleys, plains, plateaus, up-slopes and down-slopes. It measures the duration of plateaus and plains, as well as the severity of peaks and valleys. It then conducts pattern-fitting analysis to find regularity over time, attempting to fit the pattern to the history and averaging for low and high points. The patterned forecast is put in context of future periods with the average trend, and the pattern is re-evaluated using demand history of subsequent periods.
If no pattern is present, the unpatterned variation method attempts to use averaged highs and lows to create a step-change forecast for future demand.
Both techniques permit zero demand to reside in the history, and will acknowledge such in the future demand forecast. In forecasting for spare parts, for example, the demand is frequently low-level and spotty, containing many periods of zero demand interspersed with low-level demand. This forecasting technique allows patterns of zero demand to be forecast into the future.
Attribute-Based Modelling
What if lack of data, short life cycle, or other mitigating factors make it difficult to forecast using time series or qualitative techniques? Forecast creation for new product introductions, short-life or seasonal products, and end-of-life products calls for attribute-based modelling techniques.
The attribute-based model provides a wide variety of demand profiles by which to characterize the product, and can adjust the product’s plan dynamically in response to early demand signals. The method will analyze historical sell-in and/or sell-through data to develop a wide variety of demand and seasonal profiles. These profiles are assigned to individual planning records. Then, as actual demand information is captured, the current profile is validated or alternate profiles identified to dynamically adjust the product’s plan.
Attribute-based modelling consists of four unique processes:
1. Creation of Demand Profiles
Creation of demand profiles is based on mathematical concepts known as Chi-squared analysis. The demand planner selects products to be included based on attribute similarities, and multiple attributes can be used at once.
2. Assigning Demand Profiles
New, seasonal, and end-of-life products can now be assigned to Demand Profiles. Advanced attribute-based models offer ‘user-defined attribute’ matching capabilities, allowing the planner to set criteria for how a new product’s attributes must match the attributes of a demand profile.
3. Automatic Revision of the Forecast Based on Demand Signals
Forecast accuracy must be monitored continually. Accuracy can be monitored using Point-of-Sale (POS) data, which is the demand signal that most accurately reflects customer buying patterns, or other demand signals such as syndicated data. Correctness-of-fit modelling adjusts the forecast to reflect what is happening in the marketplace, quickly reacting to real- world changes.
4. Assess Accuracy of Demand Profile Based on Demand Signals
New products do not always sell just like previous products with similar attributes. The accuracy of the assigned profile can be checked against others. Through Relative-Error- Index (REI) calculations the planner can quickly see which demand profile now has the best fit based on current demand trends and swap it into place.
Proportional Profile Planning
Demand Planning, Sourcing, Supply and Production Planning all perform better when demand is disaggregated from a high-level forecast down to accurate, granular, sub-SKU forecasts as early as possible in the product life cycle. Sub-SKU forecasting based on attributes (translating high-level forecasts into specific quantities for each size, colour, configuration, etc.) lets forecasters create more accurate forecasts across thousands or tens of thousands of SKUs.
Creating sub-SKU forecasts based on attributes such as finish, style, colour, size, gender, region, speed, power, material type, trim level, configuration, and more is called proportional profile planning. Many industries create unconstrained demand plans at the category or product level, but have insufficient resources to break these plans into accurate proportional profiles, because an aggregate demand plan can explode into orders-of-magnitude greater complexity at the SKU level.
Proportional profile planning allows demand planners to work at a level of aggregation that matches their business requirements, while allocating the forecast accurately across product attributes and options at lower levels of aggregation before submitting to the supply-side team. The profile library may contain hundreds or thousands of named, relevant demand histories built from items with similar attributes from previous seasons, other product families, etc. These histories become templates for new profiles of size, configuration, colour, or any other attribute.
Causal Event Modelling
Causal modelling can specifically address the effects of promotional elements such as price discounts, coupons, advertising and product placements. It supports input from multiple marketing groups, and aids the identification and reconciliation of potential conflicts or overlaps in promotional planning proposals.
Causal modelling enables planners to quickly simulate marketing program options and refine forecasts. Using pre-trained neural network technology in causal-based modelling is a unique best practice that lets planners quickly start to model the cause-and-effect relationship of different promotional elements.
“Backcasting” is a technique in which past promotional events are entered into the neural network, which then learns the relationship of various elements. The pre-trained network takes on customized characteristics and behaviours quickly, rather than requiring 12—18 months to build from scratch. Using pre-trained neural network technology, planners can incorporate marketing activities into supply chain forecasts much more quickly.
Summary: Flexibility and Ease of Use are Vital to Good Forecasting
Optimal demand planning and forecasting requires comprehensive modelling capabilities plus the flexibility and ease-of-use to shift methods as life cycles progress and market conditions change. Advanced forecasting systems use a combination of qualitative and quantitative techniques to generate reliable forecasts.
As we have seen, Attribute-based methods that use demand profiles are often suited to new product introduction and end of product life cycles, at times when reliable historical demand data is lacking or the available data is less relevant.
At the more mature stages of the product life cycle, five different time-series statistical models come into play, including modified Holt, Holt-Winters, moving average, and intermittent for low demand, whether patterned or unpatterned. These models are used to create retrospective forecasts that cover prior periods (typically three years) of documented demand. The forecasts are then matched to actual demand history to determine which one best fits the real-world data. The best-fit winner is used to create an objective base forecast. At this point, planners may include more qualitative calculations based on personal knowledge and experience with intangible market factors.
Causal methods are used throughout the life cycle to adjust forecasts in anticipation of promotional events. Causal methods allow planners to predict how discounting and other promotional factors will affect volume, and layer the impact of these events on top of the underlying base forecast.
Finally, Derived models can be used to create a Parent-Child relationship in which forecasts for closely related products are driven as a percentage of the forecast for a ‘leader’ product. This ensures that when the forecast is modified for the ‘parent’ all the ‘child’ forecasts would be updated accordingly.
Advanced demand management software can automate much of the selection and switching of methods as a product moves through its life cycle. A best-in-class forecasting system is one that provides flexibility for users to weight elements and override key parameters in the forecast calculation based on their intuitive knowledge and market expertise. It will help planners pick the best method, spot trends and forecast demand signal changes more quickly, and sense the best time to change methods when a more appropriate approach is indicated. Superior predictive power and real-time reflexes are the keys to coming out ahead of the competition during uncertain business cycles.

Contributed by: Jonathan Jackman, EMEA Sales Director, Logility Supply Chain Solutions